The client is a mid-sized bank operating with multiple digital and core banking systems. Over time, the bank adopted different ERP platforms to support branch banking, digital banking, and reporting needs. Key systems included DCI, a key banking platform, and Q2, a cloud based digital banking solution. While these systems supported daily operations, leadership struggled to get a clear view of business performance.
Challenges
The bank faced serious reporting and visibility issues across departments and systems.
Major challenges included:
Data scattered across multiple ERP systems with separate databases.
Time consuming reconciliation of data for leadership reporting.
Different customer IDs across digital and branch banking systems.
Limited visibility into loans, savings, and deposits by customer and product.
No consistent view by geography, salesperson, channel, or time period.
Heavy reliance on manual reporting using Excel and PowerPoint.
Static reports that did not support deep analysis or drill downs.
As a result, executives lacked timely insights needed for decision making.
Goals & Objective
The bank wanted a single, dynamic reporting system that could bring all business data into one trusted place. Their aim was to give leadership real time insights, improve visibility across customers, products, and regions, cut down manual reporting work for IT and finance teams, and support smarter decisions based on reliable data across the whole bank.
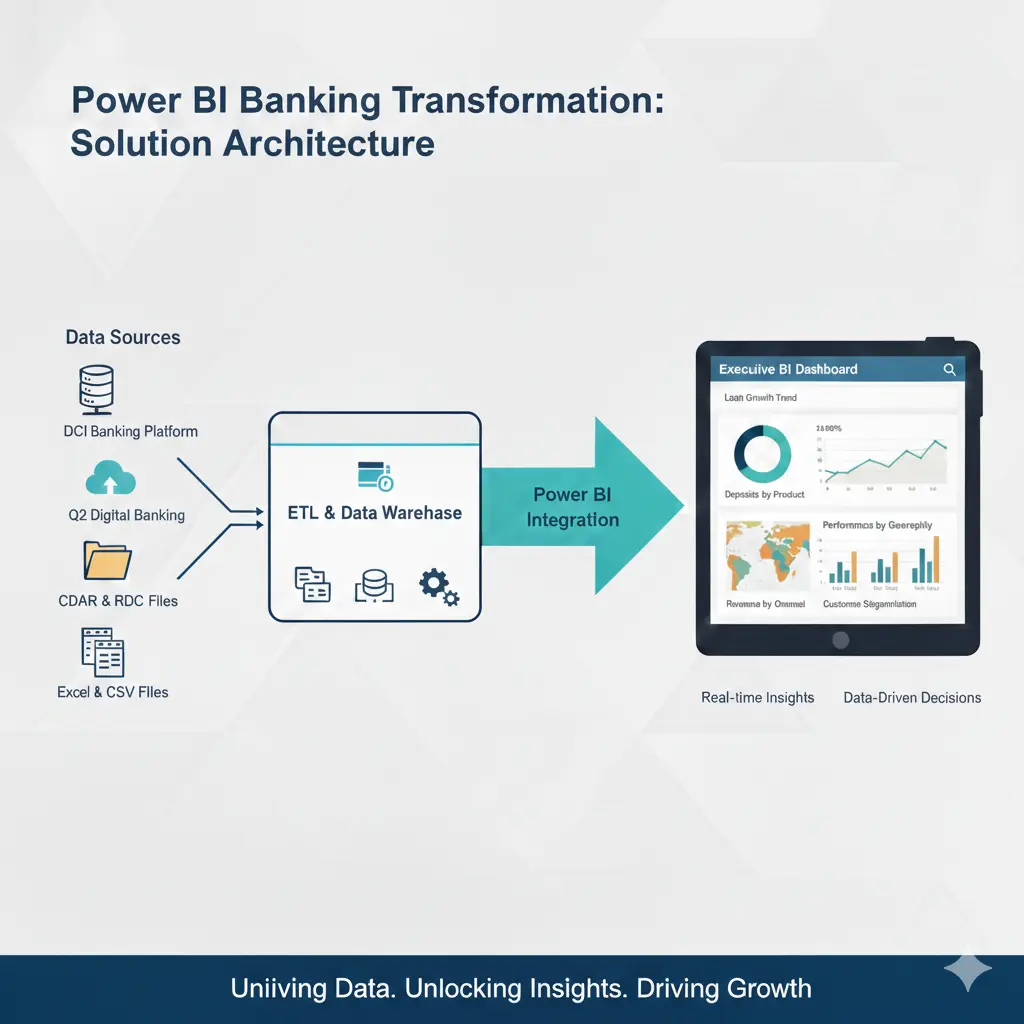
Solutions
ACME One partnered with the bank to design and implement a Power BI based business intelligence solution. The engagement began with a detailed assessment of the bank’s IT environment. Data was initially collected from the IT team in the form of CSV and Excel files to support a pilot phase. A Power BI executive dashboard was developed for the CEO to demonstrate value quickly and gain stakeholder alignment.
Implementation
The implementation followed a structured and phased approach.
Key activities included:
Mapping the bank’s IT landscape, including systems, databases, and tools.
Designing a data warehouse schema to support reporting needs.
Developing the data warehouse and reporting layer.
Building Power BI dashboards and reports based on agreed KPIs.
Performing Power BI analysis on data from DCI, Q2, CDAR, and RDC files.
Special attention was given to customer data mapping to improve visibility across digital and branch systems.
Result
Centralized Data Visibility
Clear View of Loans and Deposits
Faster Executive Reporting
Reduced manual work
Interactive Dashboards
Better Decision Insights
Outcomes
Centralized Data Visibility
Clear view of Loans and Deposits
Faster Executive Reporting
Reduced Manual Work
Interactive Dashboards
Better Decision Insights
What Our Client Says
Don’t just take our word for it. Hear what our satisfied clients have to say about their experience partnering with ACME ONE
“The Power BI dashboards transformed how we view our data. Leadership now has a clear and timely picture of performance without relying on manual reports.”
Client Team
Get In Touch With Us Today
We’re here to help! If you have any questions or would like to discuss.
Contact Info
We’re here to help! If you have any questions or would like to discuss how our IT services and technology solutions can benefit your business,
Our Location
Meydan – Nad Al Sheba – Dubai – United Arab Emirates
We’re here to help! If you have any questions or would like to explore how our custom software, digital solutions, and IT expertise can support your business growth.